Reviewing Recommendations
Reviewing Recommendations
Section titled “Reviewing Recommendations”This guide explains how to view and interpret OptiPod’s resource recommendations before enabling automatic optimization.
Overview
Section titled “Overview”OptiPod stores recommendations as annotations on workload resources. You can review these recommendations using:
- kubectl commands to view annotations
- The optipod-recommendation-report.sh script for formatted reports
- Kubernetes events for optimization activity
Quick Check
Section titled “Quick Check”View recommendations for a specific workload:
kubectl get deployment my-app -o yaml | grep "optipod.io"Annotation Format
Section titled “Annotation Format”OptiPod uses these annotations to store recommendations:
Management Annotations
Section titled “Management Annotations”metadata: annotations: # Indicates OptiPod manages this workload optipod.io/managed: "true"
# Policy name managing this workload optipod.io/policy: "production-policy"
# Policy UID for tracking optipod.io/policy-uid: "abc123..."
# Timestamp of last recommendation optipod.io/last-recommendation: "2025-01-28T10:30:00Z"
# Timestamp of last applied change (Auto mode only) optipod.io/last-applied: "2025-01-28T10:35:00Z"
# Strategy used (ssa or webhook) optipod.io/strategy: "webhook"Resource Recommendations (Per Container)
Section titled “Resource Recommendations (Per Container)”metadata: annotations: # CPU request recommendation optipod.io/cpu-request.app: "500m"
# Memory request recommendation optipod.io/memory-request.app: "1Gi"
# CPU limit recommendation (if updateRequestsOnly=false) optipod.io/cpu-limit.app: "750m"
# Memory limit recommendation (if updateRequestsOnly=false) optipod.io/memory-limit.app: "1.1Gi"Format: optipod.io/<resource>.<container-name>
Viewing Recommendations
Section titled “Viewing Recommendations”Method 1: kubectl get
Section titled “Method 1: kubectl get”View all annotations:
kubectl get deployment my-app -o jsonpath='{.metadata.annotations}' | jqView specific recommendation:
# CPU request for container "app"kubectl get deployment my-app \  -o jsonpath='{.metadata.annotations.optipod\.io/cpu-request\.app}'
# Memory request for container "app"kubectl get deployment my-app \  -o jsonpath='{.metadata.annotations.optipod\.io/memory-request\.app}'
Method 2: kubectl describe
Section titled “Method 2: kubectl describe”kubectl describe deployment my-appLook for the Annotations section:
Annotations: optipod.io/cpu-request.app: 500m optipod.io/memory-request.app: 1Gi optipod.io/managed: true optipod.io/policy: production-policyMethod 3: Recommendation Report Script
Section titled “Method 3: Recommendation Report Script”OptiPod provides a script to generate formatted reports:
./scripts/optipod-recommendation-report.shJSON output (default):
./scripts/optipod-recommendation-report.sh --output jsonHTML output:
./scripts/optipod-recommendation-report.sh --output html --file report.htmlFilter by namespace:
./scripts/optipod-recommendation-report.sh --namespace productionFilter by workload types:
./scripts/optipod-recommendation-report.sh --kinds deploy,stsMethod 4: All Workloads with Recommendations
Section titled “Method 4: All Workloads with Recommendations”List all managed workloads:
# Deploymentskubectl get deployments -A \  -o jsonpath='{range .items[?(@.metadata.annotations.optipod\.io/managed=="true")]}{.metadata.namespace}{"\t"}{.metadata.name}{"\n"}{end}'
# StatefulSetskubectl get statefulsets -A \  -o jsonpath='{range .items[?(@.metadata.annotations.optipod\.io/managed=="true")]}{.metadata.namespace}{"\t"}{.metadata.name}{"\n"}{end}'
# DaemonSetskubectl get daemonsets -A \  -o jsonpath='{range .items[?(@.metadata.annotations.optipod\.io/managed=="true")]}{.metadata.namespace}{"\t"}{.metadata.name}{"\n"}{end}'
Interpreting Recommendations
Section titled “Interpreting Recommendations”Comparing Current vs Recommended
Section titled “Comparing Current vs Recommended”View current resources:
kubectl get deployment my-app \ -o jsonpath='{.spec.template.spec.containers[0].resources}' | jqOutput:
{ "requests": { "cpu": "1000m", "memory": "2Gi" }, "limits": { "cpu": "2000m", "memory": "4Gi" }}View recommendations:
kubectl get deployment my-app -o yaml | grep "optipod.io/.*-request\|optipod.io/.*-limit"Output:
optipod.io/cpu-request.app: 500moptipod.io/memory-request.app: 1Gioptipod.io/cpu-limit.app: 750moptipod.io/memory-limit.app: 1.1GiAnalysis:
- Current CPU request: 1000m → Recommended: 500m (50% reduction)
- Current memory request: 2Gi → Recommended: 1Gi (50% reduction)
- Potential savings: ~50% resource reduction
Understanding the Calculation
Section titled “Understanding the Calculation”Recommendations are calculated as:
Recommendation = Percentile(Usage) × SafetyFactorClamped to resource bounds:
If recommendation < min → Use minIf recommendation > max → Use maxOtherwise → Use recommendationExample:
- P90 CPU usage: 400m
- Safety factor: 1.2
- Raw recommendation: 400m × 1.2 = 480m
- Bounds: min=100m, max=4000m
- Final recommendation: 480m (within bounds)
Checking Policy Configuration
Section titled “Checking Policy Configuration”View the policy that generated recommendations:
# Get policy name from annotationPOLICY=$(kubectl get deployment my-app \  -o jsonpath='{.metadata.annotations.optipod\.io/policy}')
# View policy detailskubectl get optimizationpolicy $POLICY -o yaml
Key fields to check:
spec.mode: Recommend or Autospec.metricsConfig.percentile: P50, P90, or P99spec.metricsConfig.safetyFactor: Buffer multiplierspec.resourceBounds: Min/max constraintsspec.updateStrategy.updateRequestsOnly: Requests only or requests+limits
Recommendation Report
Section titled “Recommendation Report”Using the Report Script
Section titled “Using the Report Script”The recommendation report script provides a comprehensive view of all recommendations:
Basic usage:
./scripts/optipod-recommendation-report.shJSON output example:
{ "timestamp": "2025-01-28T10:30:00Z", "summary": { "total_workloads": 10, "with_recommendations": 8, "potential_savings": { "cpu": "4500m", "memory": "12Gi" } }, "workloads": [ { "namespace": "production", "name": "my-app", "kind": "Deployment", "policy": "production-policy", "containers": [ { "name": "app", "current": { "cpu_request": "1000m", "memory_request": "2Gi", "cpu_limit": "2000m", "memory_limit": "4Gi" }, "recommended": { "cpu_request": "500m", "memory_request": "1Gi", "cpu_limit": "750m", "memory_limit": "1.1Gi" }, "savings": { "cpu_request": "500m (50%)", "memory_request": "1Gi (50%)" } } ] } ]}HTML output:
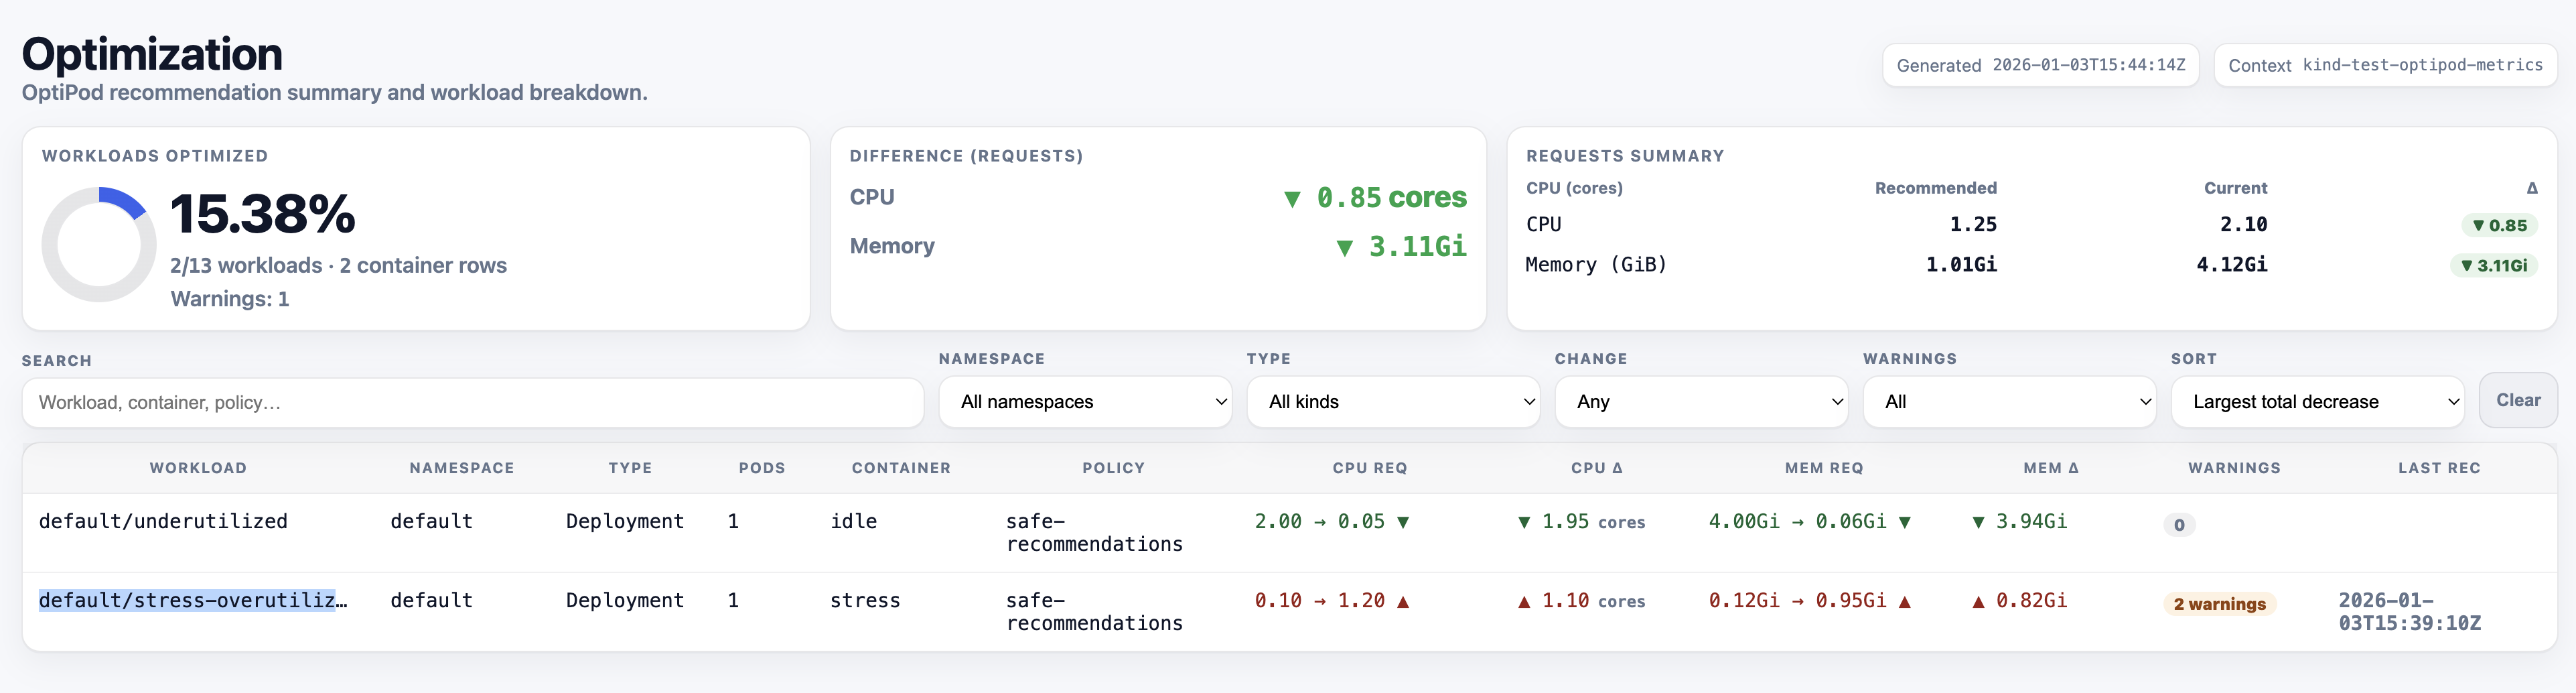
The HTML report provides a visual comparison with:
- Color-coded savings (green = savings, red = increase)
- Sortable tables
- Summary statistics
- Per-workload breakdown
./scripts/optipod-recommendation-report.sh --output html --file report.htmlopen report.html # macOSxdg-open report.html # LinuxExample HTML Report:
Report Sections
Section titled “Report Sections”Summary:
- Total workloads scanned
- Workloads with recommendations
- Potential resource savings
- Average savings percentage
Per-Workload Details:
- Namespace and name
- Workload kind (Deployment, StatefulSet, DaemonSet)
- Managing policy
- Per-container current vs recommended resources
- Savings calculations
Warnings:
- Recommendations exceeding current limits (when updateRequestsOnly=true)
- Missing recommendations
- Validation issues
Monitoring Recommendations
Section titled “Monitoring Recommendations”Kubernetes Events
Section titled “Kubernetes Events”OptiPod emits events for optimization activity:
# View all OptiPod eventskubectl get events -A --field-selector source=optipod
# View events for specific workloadkubectl get events --field-selector involvedObject.name=my-app
# View recommendation eventskubectl get events --field-selector reason=RecommendationGenerated
Event types:
RecommendationGenerated: New recommendation createdOptimizationApplied: Recommendation applied (Auto mode)OptimizationSkipped: Recommendation not applied (Recommend mode)ValidationFailed: Policy validation errorOptimizationFailed: Failed to apply recommendation
Policy Status
Section titled “Policy Status”Check policy status for workload counts:
kubectl get optimizationpolicy production-policy -o yamlStatus fields:
status: workloadsDiscovered: 10 workloadsProcessed: 8 lastReconciliation: "2025-01-28T10:30:00Z" workloadsByType: deployments: 6 statefulSets: 2 daemonSets: 0Prometheus Metrics
Section titled “Prometheus Metrics”If Prometheus is configured, query OptiPod metrics:
# Recommendations generatedoptipod_recommendations_generated_total
# Optimizations appliedoptipod_optimizations_applied_total
# Resource change magnitudeoptipod_resource_change_magnitude_percent
Common Scenarios
Section titled “Common Scenarios”Scenario 1: Over-Provisioned Workload
Section titled “Scenario 1: Over-Provisioned Workload”Current:
resources: requests: cpu: "2000m" memory: "4Gi"Recommended:
optipod.io/cpu-request.app: 500moptipod.io/memory-request.app: 1GiAnalysis:
- 75% CPU reduction (1500m savings)
- 75% memory reduction (3Gi savings)
- Workload is significantly over-provisioned
- Safe to apply recommendations
Action: Switch policy to Auto mode for this workload.
Scenario 2: Under-Provisioned Workload
Section titled “Scenario 2: Under-Provisioned Workload”Current:
resources: requests: cpu: "100m" memory: "256Mi"Recommended:
optipod.io/cpu-request.app: 500moptipod.io/memory-request.app: 1GiAnalysis:
- 400m CPU increase needed
- 768Mi memory increase needed
- Workload is under-provisioned
- May be experiencing throttling or OOM
Action: Apply recommendations to improve performance.
Scenario 3: Well-Sized Workload
Section titled “Scenario 3: Well-Sized Workload”Current:
resources: requests: cpu: "500m" memory: "1Gi"Recommended:
optipod.io/cpu-request.app: 520moptipod.io/memory-request.app: 1050MiAnalysis:
- Minimal changes (4% increase)
- Workload is well-sized
- Recommendations account for safety factor
Action: No immediate action needed, continue monitoring.
Scenario 4: Recommendation Exceeds Limit
Section titled “Scenario 4: Recommendation Exceeds Limit”Current:
resources: requests: cpu: "100m" memory: "256Mi" limits: cpu: "200m" memory: "512Mi"Recommended (updateRequestsOnly=true):
optipod.io/cpu-request.app: 500moptipod.io/memory-request.app: 1GiAnalysis:
- Recommended request exceeds current limit
- Will cause validation error if applied
- Need to update limits or change policy
Action:
- Set
updateRequestsOnly: falsein policy, or - Manually update limits before applying, or
- Adjust resource bounds in policy
Validation Before Applying
Section titled “Validation Before Applying”Check 1: Recommendations Within Bounds
Section titled “Check 1: Recommendations Within Bounds”Verify recommendations respect policy bounds:
# Get policy boundskubectl get optimizationpolicy production-policy \  -o jsonpath='{.spec.resourceBounds}' | jq
# Compare with recommendationskubectl get deployment my-app -o yaml | grep "optipod.io/.*-request"
Check 2: No Limit Conflicts
Section titled “Check 2: No Limit Conflicts”If updateRequestsOnly: true, ensure recommendations don’t exceed limits:
# Get current limitskubectl get deployment my-app \  -o jsonpath='{.spec.template.spec.containers[0].resources.limits}' | jq
# Compare with recommended requestskubectl get deployment my-app -o yaml | grep "optipod.io/.*-request"
Check 3: Safety Factor Applied
Section titled “Check 3: Safety Factor Applied”Verify safety factor is appropriate:
kubectl get optimizationpolicy production-policy \ -o jsonpath='{.spec.metricsConfig.safetyFactor}'Recommended values:
- Stable workloads: 1.1 - 1.2
- Variable traffic: 1.2 - 1.5
- Critical services: 1.5 - 2.0
Check 4: Recent Metrics
Section titled “Check 4: Recent Metrics”Ensure recommendations are based on recent data:
# Check last recommendation timestampkubectl get deployment my-app \ -o jsonpath='{.metadata.annotations.optipod\.io/last-recommendation}'If timestamp is old, recommendations may be stale.
Troubleshooting
Section titled “Troubleshooting”No Recommendations
Section titled “No Recommendations”Possible causes:
- Workload doesn’t match policy selector
- Policy is in Disabled mode
- Insufficient metrics data
- Policy validation failed
Check:
# Verify policy modekubectl get optimizationpolicy my-policy -o jsonpath='{.spec.mode}'
# Check policy statuskubectl describe optimizationpolicy my-policy
# View eventskubectl get events --field-selector reason=ValidationFailed
Stale Recommendations
Section titled “Stale Recommendations”Possible causes:
- Policy reconciliation interval too long
- Controller not running
- Metrics provider unavailable
Check:
# Check reconciliation intervalkubectl get optimizationpolicy my-policy \  -o jsonpath='{.spec.reconciliationInterval}'
# Check controller logskubectl logs -n optipod-system deployment/optipod-controller
# Verify metrics providerkubectl get --raw /apis/metrics.k8s.io/v1beta1/nodes
Unexpected Recommendations
Section titled “Unexpected Recommendations”Possible causes:
- Incorrect safety factor
- Wrong percentile selection
- Insufficient metrics window
- Workload behavior changed
Check:
# Review policy configurationkubectl get optimizationpolicy my-policy -o yaml
# Check metrics configurationkubectl get optimizationpolicy my-policy \  -o jsonpath='{.spec.metricsConfig}' | jq
Best Practices
Section titled “Best Practices”- Review regularly - Check recommendations weekly
- Start with Recommend mode - Validate before enabling Auto
- Use the report script - Get comprehensive view of all recommendations
- Monitor events - Watch for optimization activity
- Check policy status - Verify workloads are being processed
- Validate bounds - Ensure recommendations are within acceptable ranges
- Test in non-production - Validate recommendations in staging first
- Document decisions - Record why recommendations were accepted/rejected
- Monitor after applying - Watch for performance issues
- Adjust policies - Refine based on observed behavior
Next Steps
Section titled “Next Steps”- Switching to Auto Mode - Enable automatic optimization
- Creating Policies - Configure optimization policies
- Troubleshooting - Common issues and solutions
- Safety Model - Understanding safety guarantees
- Annotations Reference - Complete annotation documentation